Connecting the Dots: The Various Considerations of Graph Visualization

In information visualization, each visualization technique has a different niche. Line charts show the relationship between two variables, and bar charts provide a way to compare values associated with different categories. However, none of these tools convey the relationship between different entities, and that is where graph visualization comes in. Here, a graph refers to a set of nodes, each of them corresponding to a particular entity, and a set of links between them, each of them corresponding to a particular relationship.
Graph visualization is used extensively in fields such as IT network analysis [1] and social media studies [2]. Many real-world systems map neatly onto a graph, such as the Internet or organizational hierarchies. While this makes graph visualizations intuitive, the complexity of reality is reflected in the complexity of the graph; the primary challenge is managing this complexity while keeping the visualization intuitive and engaging, and this involves various considerations.
Consideration #1: The Type of Data
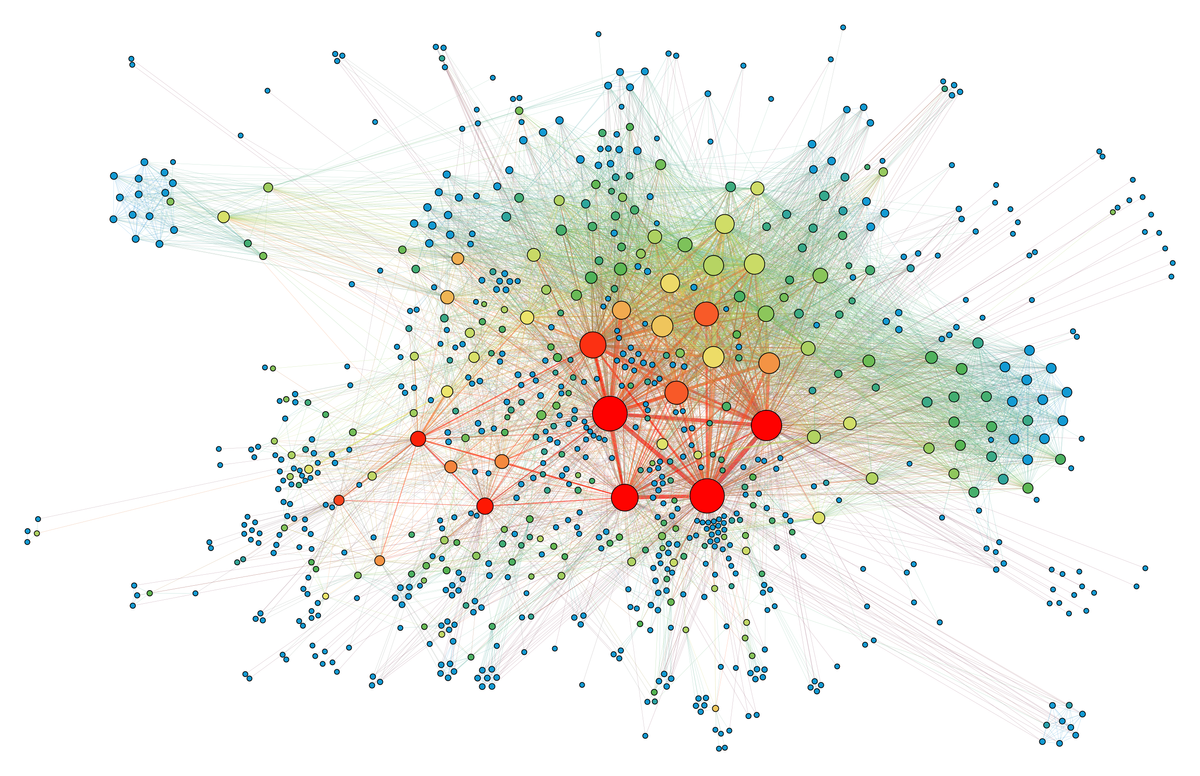
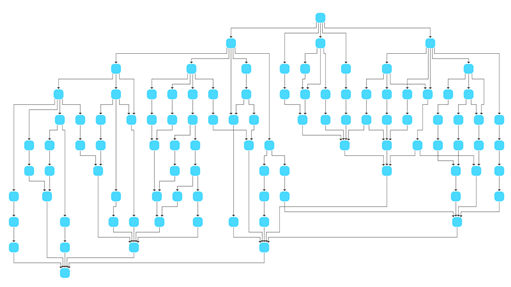
Let’s consider a corporate hierarchy. Imagine if you encounter a visualization that looks like Figure 1 below:
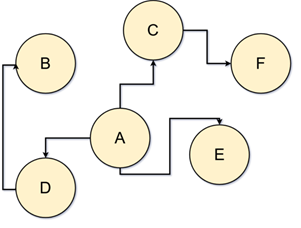
What’s going on here? While it’s possible to determine the full hierarchy if the number of nodes is small, it is not easy. Consider Figure 2:
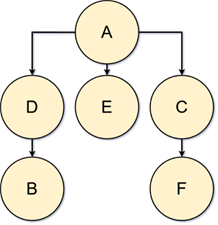
Here, it’s transparent to us that A is on top. Different data types suit different styles of graph visualization. Sometimes, a layout like Figure 1 is more appropriate, like in social media interactions. For hierarchical data, Figure 2 shows a more appropriate layout. If it’s a graph showing matches between two groups, then a bipartite graph is the most intuitive. The first consideration should always be the type of the underlying data.
Consideration #2: Layout Algorithms
Let’s zoom into the core technical aspect of graph visualization: layout algorithms. Layout algorithms are methods used to assign positions to nodes and edges [3]. One common example is a force-directed layout. In the Fruchterman-Reingold layout, nodes repel one another, while edges act as springs. With these physics-inspired rules, the visualization has an optimal layout [4].
The Kamada-Kawai algorithm takes it a step further by connecting springs between each node, regardless of whether they are connected or not [5]. While the former is good for emphasizing node-to-node interaction, the latter better preserves the relative distance between nodes [5]. However, both of these approaches run in O(n^2) where n is the number of nodes, so be careful when working with large datasets [4].
Working with hierarchical data? The Sugiyama algorithm places nodes into different horizontal layers, resulting in a graph that looks like an organizational chart. With this distinct layering it’s more intuitive to follow hierarchies and process flows. However, take note that this method only works with directed acyclic graphs [7].
These are just two different layout approaches. Choosing a layout algorithm is an important consideration when it comes to graph visualization.
Consideration #3: Scale!
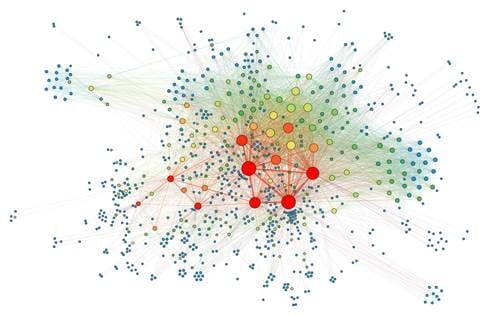
Real-world graphs can be massive. Imagine a graph containing every single Facebook user? Visualizing everything will be counter-productive, as it can lead to indecipherable messes known as “hairballs” [9]. This scalability problem can be solved in a few ways.
Firstly, clusters of nodes can be combined into a single node (a technique known as “node aggregation”), which preserves the high-level structure of the graph. This could possible be integrated with some form of multi-level view. Of course, there is also the option of only viewing a sample of the graph, but this can lead to the loss of key details [9]. If it is critical to maintain the same level of detail, GPU acceleration might be the last step.
Remember that if there is no way to present a graph in a useful way, you might want to consider other visualization types.
Conclusion
In conclusion, graph visualization provides an intuitive way of representing entities and the relationships between them, but it’s critical to consider the type of data, the layout, and the scale of the graph in the creation process.
[1] Cambridge Intelligence, “Network visualization: A detailed guide,” cambridge-intelligence.com. https://cambridge-intelligence.com/why-visualize-networks/ (accessed Apr. 7, 2025).
[2] Cambridge Intelligence, “Data visualization for social network analysis,” cambridge-intelligence.com. https://cambridge-intelligence.com/use-cases/social-networks/ (accessed Apr. 7, 2025).
[3] S. D. Bartolomeo, T. Crnovrsanin, D. Saffo, E. Puerta, C. Wilson, and C. Dunne, “Evaluating Graph Layout Algorithms: A Systematic Review of Methods and Best Practices,” Computer Graphics Forum, vol. 43, no. 6, pp. 1, 2024. Accessed Apr. 7, 2025. doi: 10.1111/cgf.15073. [Online]. Available: https://onlinelibrary.wiley.com/doi/pdf/10.1111/cgf.15073
[4] T. M. J. Fruchterman and E. M. Reingold, “Graph Drawing by Force-directed Placement,” Software—Practice and Experience, vol. 21, pp. 1129-1164. Accessed Apr. 7, 2025. doi: 10.1002/spe.4380211102. [Online]. Available: https://onlinelibrary.wiley.com/doi/abs/10.1002/spe.4380211102
[5] SocNetV, “Visualization,” socnetv.org. https://socnetv.org/manual/visualization/ (accessed Apr. 7, 2025).
[6] Martin Grandjean, “SocialNetworkAnalysis.png,” 2015. Accessed: Apr. 7, 2025. [Electronic image]. Available: https://upload.wikimedia.org/wikipedia/commons/2/22/SocialNetworkAnalysis.png. CC BY-SA 4.0
[7] Igraph, “The Sugiyama graph layout generator,” igraph.org. https://igraph.org/r/html/1.2.6/layout_with_sugiyama.html (accessed Apr. 7, 2025).
[8] Yworks, “Layered Graph Layout,” yworks.com. https://www.yworks.com/pages/layered-graph-layout (accessed Apr. 7, 2025).
[9] D. Williams, “Graph visualization: fixing data hairballs,” cambridge-intelligence.com. https://cambridge-intelligence.com/how-to-fix-hairballs/ (accessed Apr. 7, 2025)


