Tech
Connecting the Dots: The Various Considerations of Graph Visualization
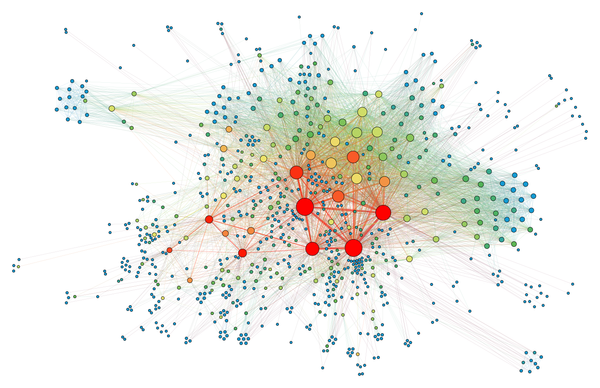
In information visualization, each visualization technique has a different niche. Line charts show the relationship between two variables, and bar charts provide a way to compare values associated with different categories. However, none of these tools convey the relationship between different entities, and that is where graph visualization comes in.